Sales KPIs that Actually Predict Success
Sep 04, 2023And how to create a 90-day sales plan using these KPIs
Tracking the right sales KPIs (key performance indicators) is essential for knowing whether you’ll meet your sales goals.
But most teams focus on the wrong metrics. They obsess over lagging KPIs like closed deals, revenue generated, and pipeline size. Those are lagging or "trailing indicators". While important, these only tell you the results after the fact. By then, it’s too late to change the outcome.
Leading indicator sales KPIs predict outcomes. For example, you can track response rates to each step in the prospecting stage. When a response rate drops below your expectations, you can course correct immediately. These leading indicators tell you the story as it’s happening, arming you with the knowledge you need to change the outcome before it’s too late.
Mastering leading indicator sales KPIs is crucial. With the right framework, you can confidently execute a data-backed plan to crush your sales targets. But without leading indicators, you’re just guessing.
In this guide, you’ll discover a proven framework for what leading indicators to track. We’ll provide benchmark conversion ratios for each KPI. Then we’ll show you how to create a 90-day sales plan. With the right data-backed plan, you can confidently execute while accurately predicting whether you'll hit your numbers.
When your ratios aren’t meeting expected benchmarks, you can promptly identify and correct the specific touch points that affect that KPI.
This means you’re no longer flying blind or waiting to see final results. You’ll know well in advance whether you’re going to meet your sales goals.
What you’ll learn:
- The key leading indicator sales KPIs that can predict sales success
- What metrics to track for a LinkedIn social selling strategy
- How to set weekly, monthly and quarterly prospecting KPIs
- A model for building a predictive 90-day sales plan
- Benchmarks you can use to measure your results
Follow this blueprint to get ahead of the curve. You don’t have to rely just on lagging indicator KPIs that offer hindsight instead of foresight. You’ll get more control over your sales outcomes by focusing on leading indicator sales KPIs tailored to your goals.
A sales KPI is a metric used to measure and evaluate performance of sales activities as they relate to predefined goals.
Most sales KPIs focus on the past. They measure trailing indicators that tell you the end score, rather than leading indicators that drive future results.
For example, common trailing indicator KPIs include:
- Total leads
- Pipeline quantity and deal size
- Number of sales closed
- Win rate percentage
- Revenue generated
These are certainly important numbers to track. But focusing exclusively on trailing indicators can be misleading or incomplete. It’s like driving while looking in the rearview mirror rather than the road ahead. They don’t let you accurately predict whether you’ll meet revenue goals.
8 Leading Indicator Sales KPIs
Leading indicator KPIs help you predict outcomes. They also let you see which sales activities are contributing to success and which efforts are failing to meet your conversion goals. By tracking those micro-conversions, you can quickly identify the specific activities, strategies and messaging that is underperforming so you can fix it. Below is a list. We’ll dig deeper into each of these sales KPIs later in this guide.
Examples of leading indicator KPIs include:
- Network growth within your target market
- Percentage of leads engaging with sales (via reciprocal emails or DMs, just opening/clicking emails)
- Percentage of meeting invitations accepted
- Number of quality conversations with leads
- Number of conversations converting to pipeline
- % of leads matching ICP
- Pipeline growth
- Time to close (pipeline velocity)
Leading indicators measure the effectiveness of your prospecting efforts, not just the output. This gives you a chance to course correct activities that aren't working BEFORE it’s too late.
To accurately gauge your prospecting success, track a mix of leading and trailing sales KPIs. Leading indicators will help you predict future results and focus on the right activities. Don't just look at the score - look at what goes into earning that score.
How Leading Indicator KPIs Predict Outcomes
There’s a big difference between tracking output vs response. For example, most sellers track their activity: number of emails or LinkedIn messages, cold calls, etc. Measuring output is important, but only if you’re also measuring responses. For example, you can send 1000’s of emails, but if only 2 reply, that’s not a very good response rate.
Leading indicator sales KPIs measure responses at each step in the communication process. I like to call these “micro conversions.”
Why is this important?
- You can’t make a sale if you don’t propose a solution.
- You can’t propose a solution if you don’t know the prospect’s pain points.
- You can’t uncover pain points without a discovery call.
- You can’t get a discovery call without starting a conversation.
- You can’t start a conversation if they don’t respond to your initial outreach.
So it all comes down to the prospects responding at each step. If they’re not responding, then we need to look at what’s happening in that specific step and correct course.
Benchmarks for the Sales KPIs You Should Be Tracking
Based on 4 years of helping sales teams implement social selling best practices and carefully tracking results, we’ve identified the most important leading indicator KPIs to accurately predict social selling results. We’ve also established benchmarks based on the average performance from members of our Prospecting Accelerator.
Here are the sales KPIs we track for LinkedIn social selling. We lay them out by each step in the funnel, measuring the response ratio rather than just raw output.
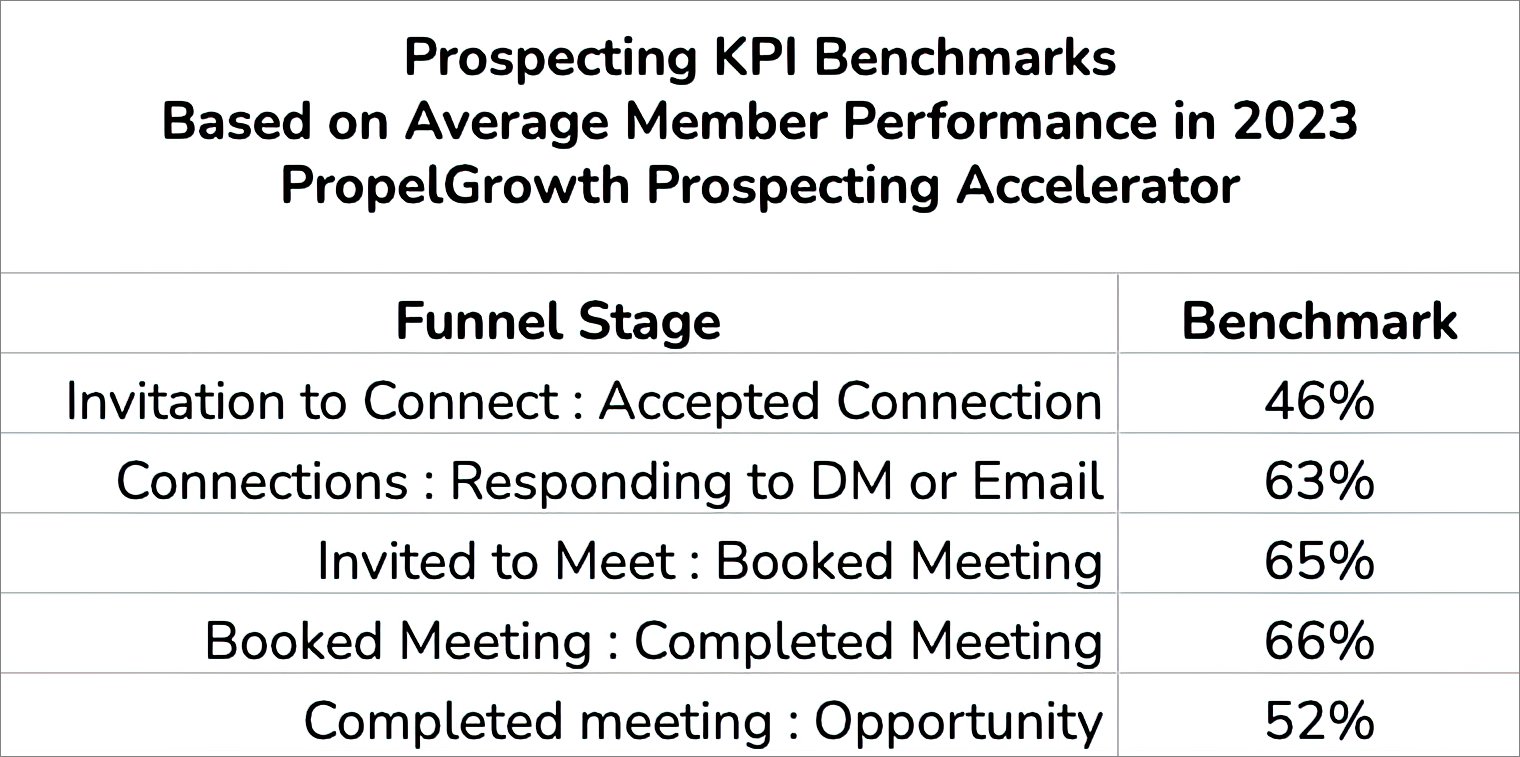
Accepted connection ratio
- Number of LinkedIn connection requests (or introductory emails) sent.
- Percentage of connection requests accepted - Benchmark - 46%
Leads engaged in dialogue
- Number of connections you DM (direct message on LinkedIn or email)
- Percentage of those DMs that receive a response - Benchmark - 63%
Leads that agree to an introductory meeting
- Number of engaged connections whom you invite to a 1:1 meeting
- Percentage of invited connections who schedule a meeting - Benchmark - 65%
Number of booked meetings
- Percentage of meetings that actually happen - Benchmark - 66%
- Percentage of meetings that turn into qualified sales opportunities - Benchmark - 52%
Stages in your sales process
From here, your standard pipeline measurements apply. These steps will vary depending on the complexity of your offering and the buying steps your clients follow.
- Percentage of qualified opportunities that get to the next step (e.g., demo or discovery).
- Percentage of demo/discovery opportunities that move to proposal.
- Percentage of proposals that move to closed/won.
90-Day Prospecting Action Plan
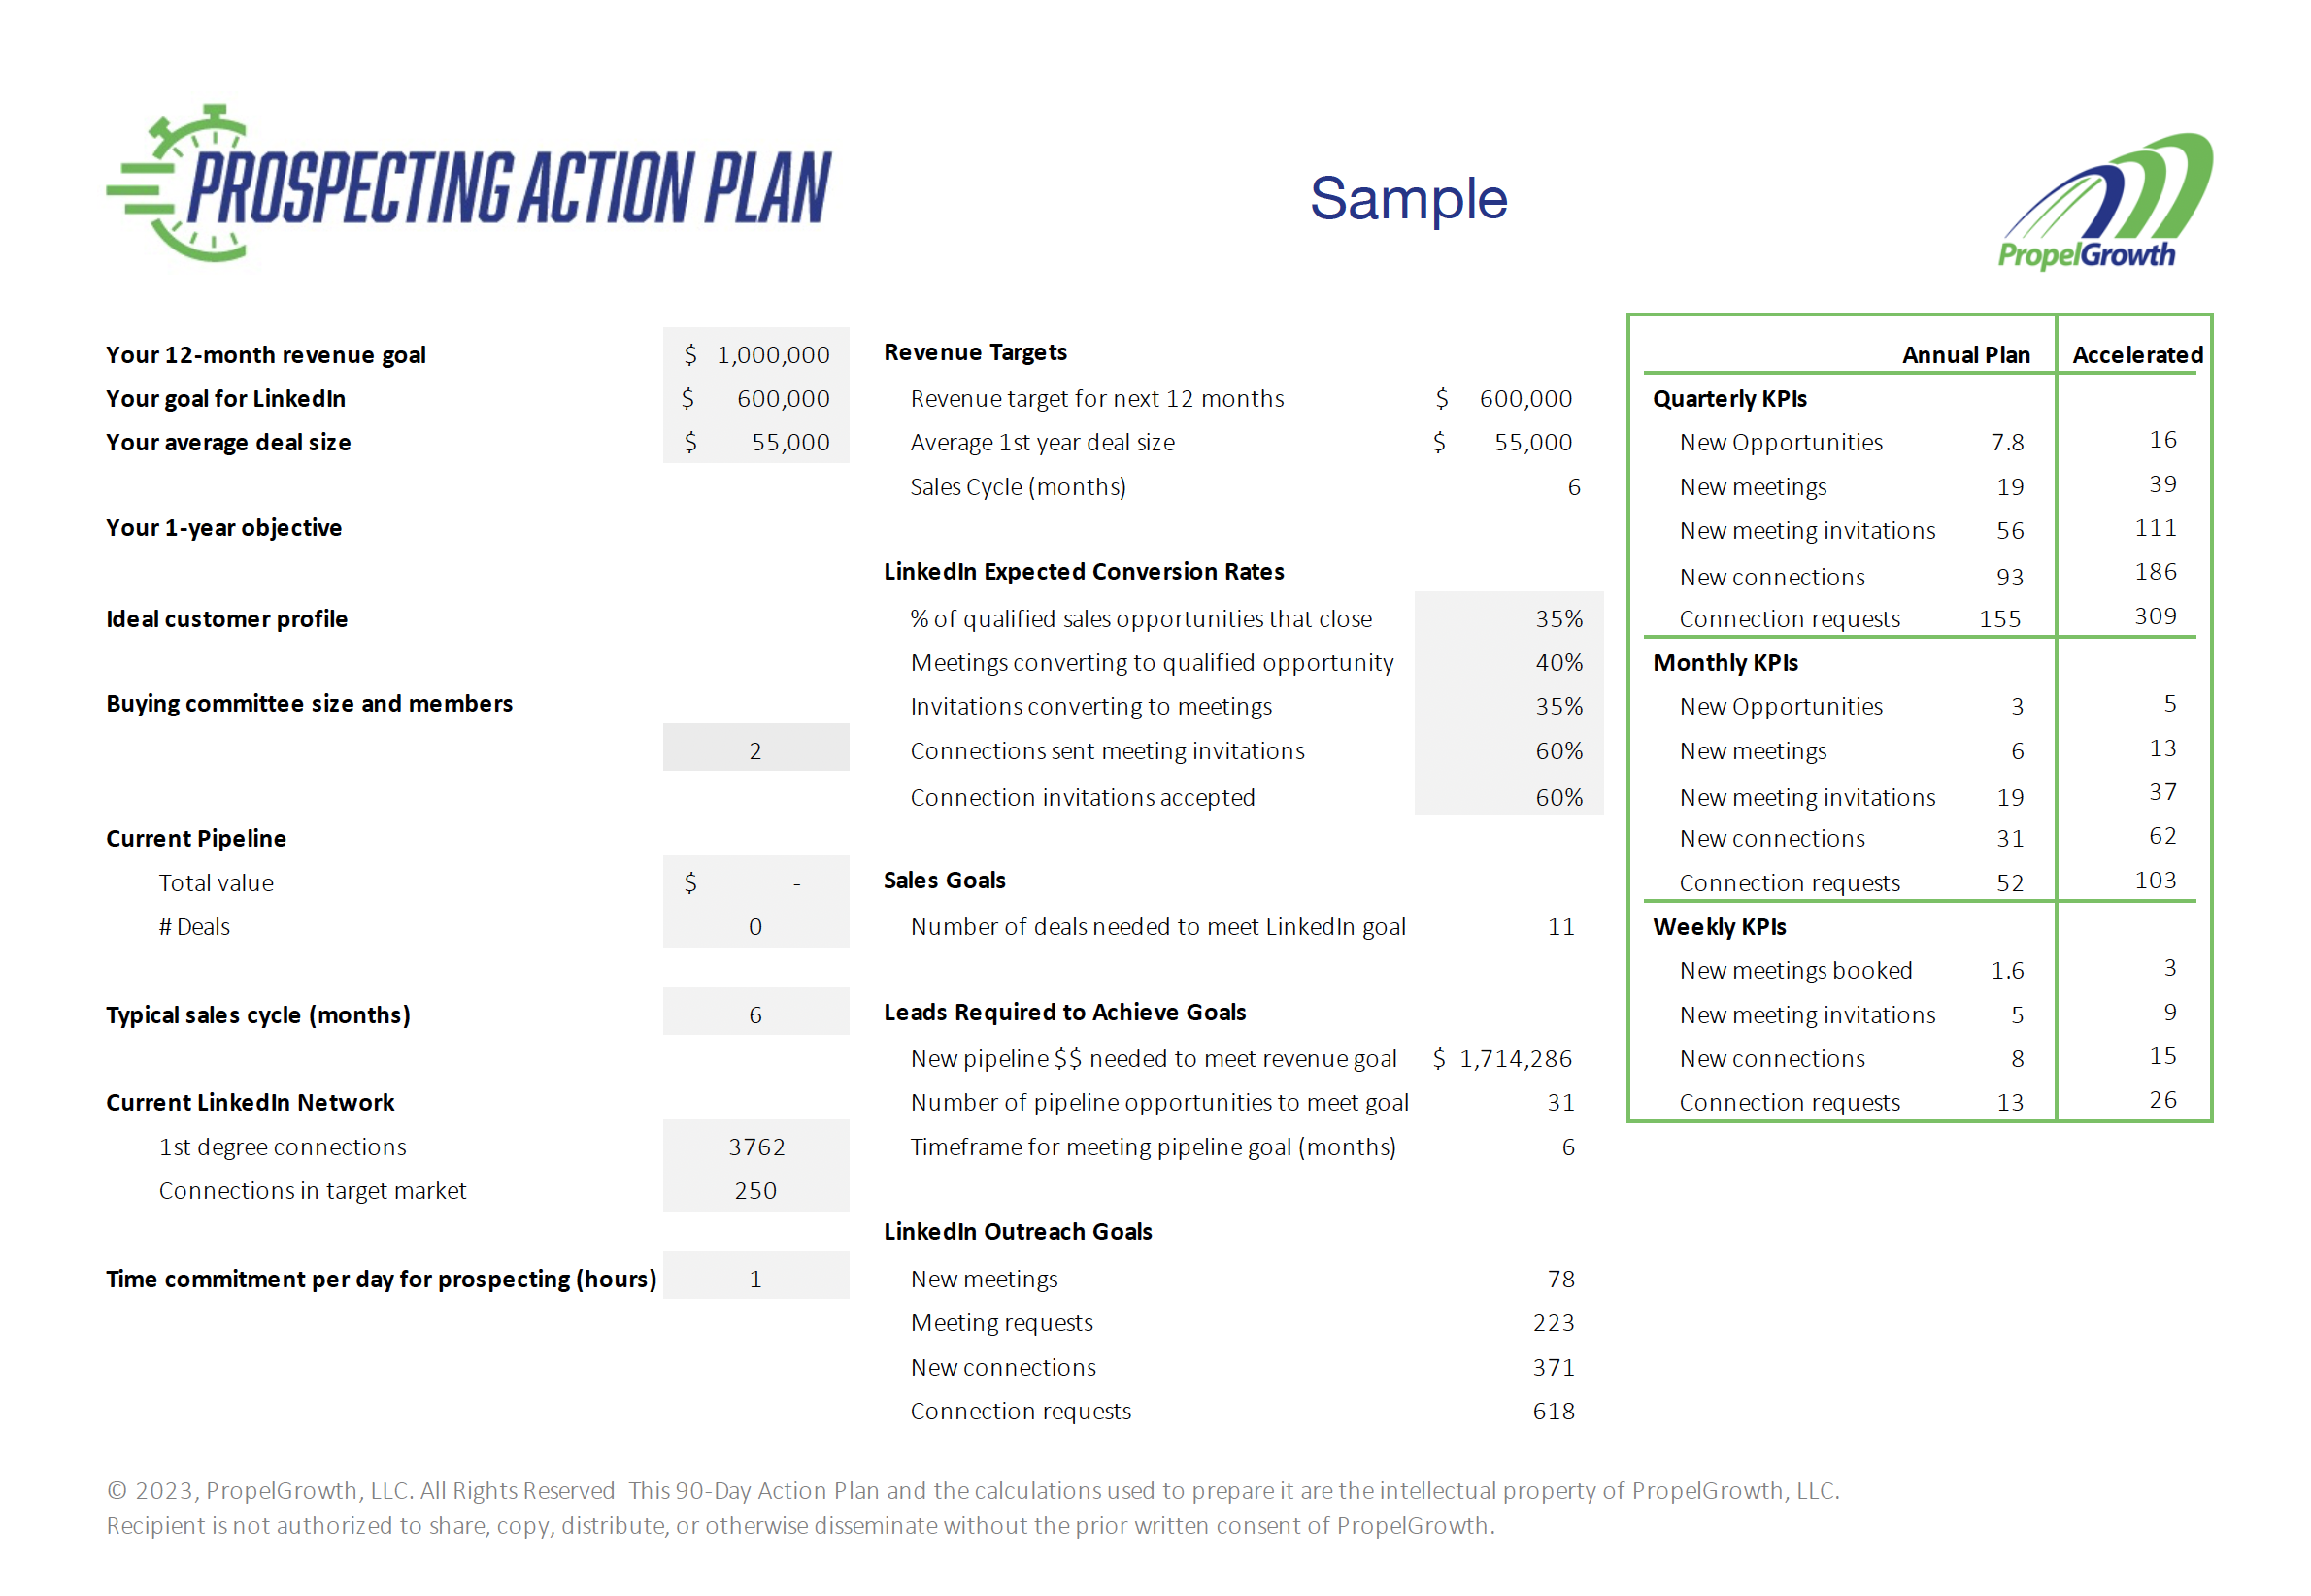
Now that you know what leading indicator sales KPIs to track, it’s time to put together a sales plan that takes these into account.
So we created a calculator to help you determine the exact prospecting activities and micro-conversion steps required to hit your specific revenue goals. This calculator produces a 90-Day Prospecting Action Plan.
The 90-Day Plan gives you a data-driven framework so you know exactly what efforts and outcomes you need to hit your sales goals.
Below, I’ll walk you through how we create this plan. You can follow the video and guide below to create your own plan. If you need help, reach out to see if you qualify to get a free personalized 90-Day Sales Plan.
Here's how it works:
First, define your revenue target, typical deal size and typical sales cycle. Then evaluate your typical conversion rates based on your historical sales performance. If you’re uncertain, you can use the sample benchmarks below.
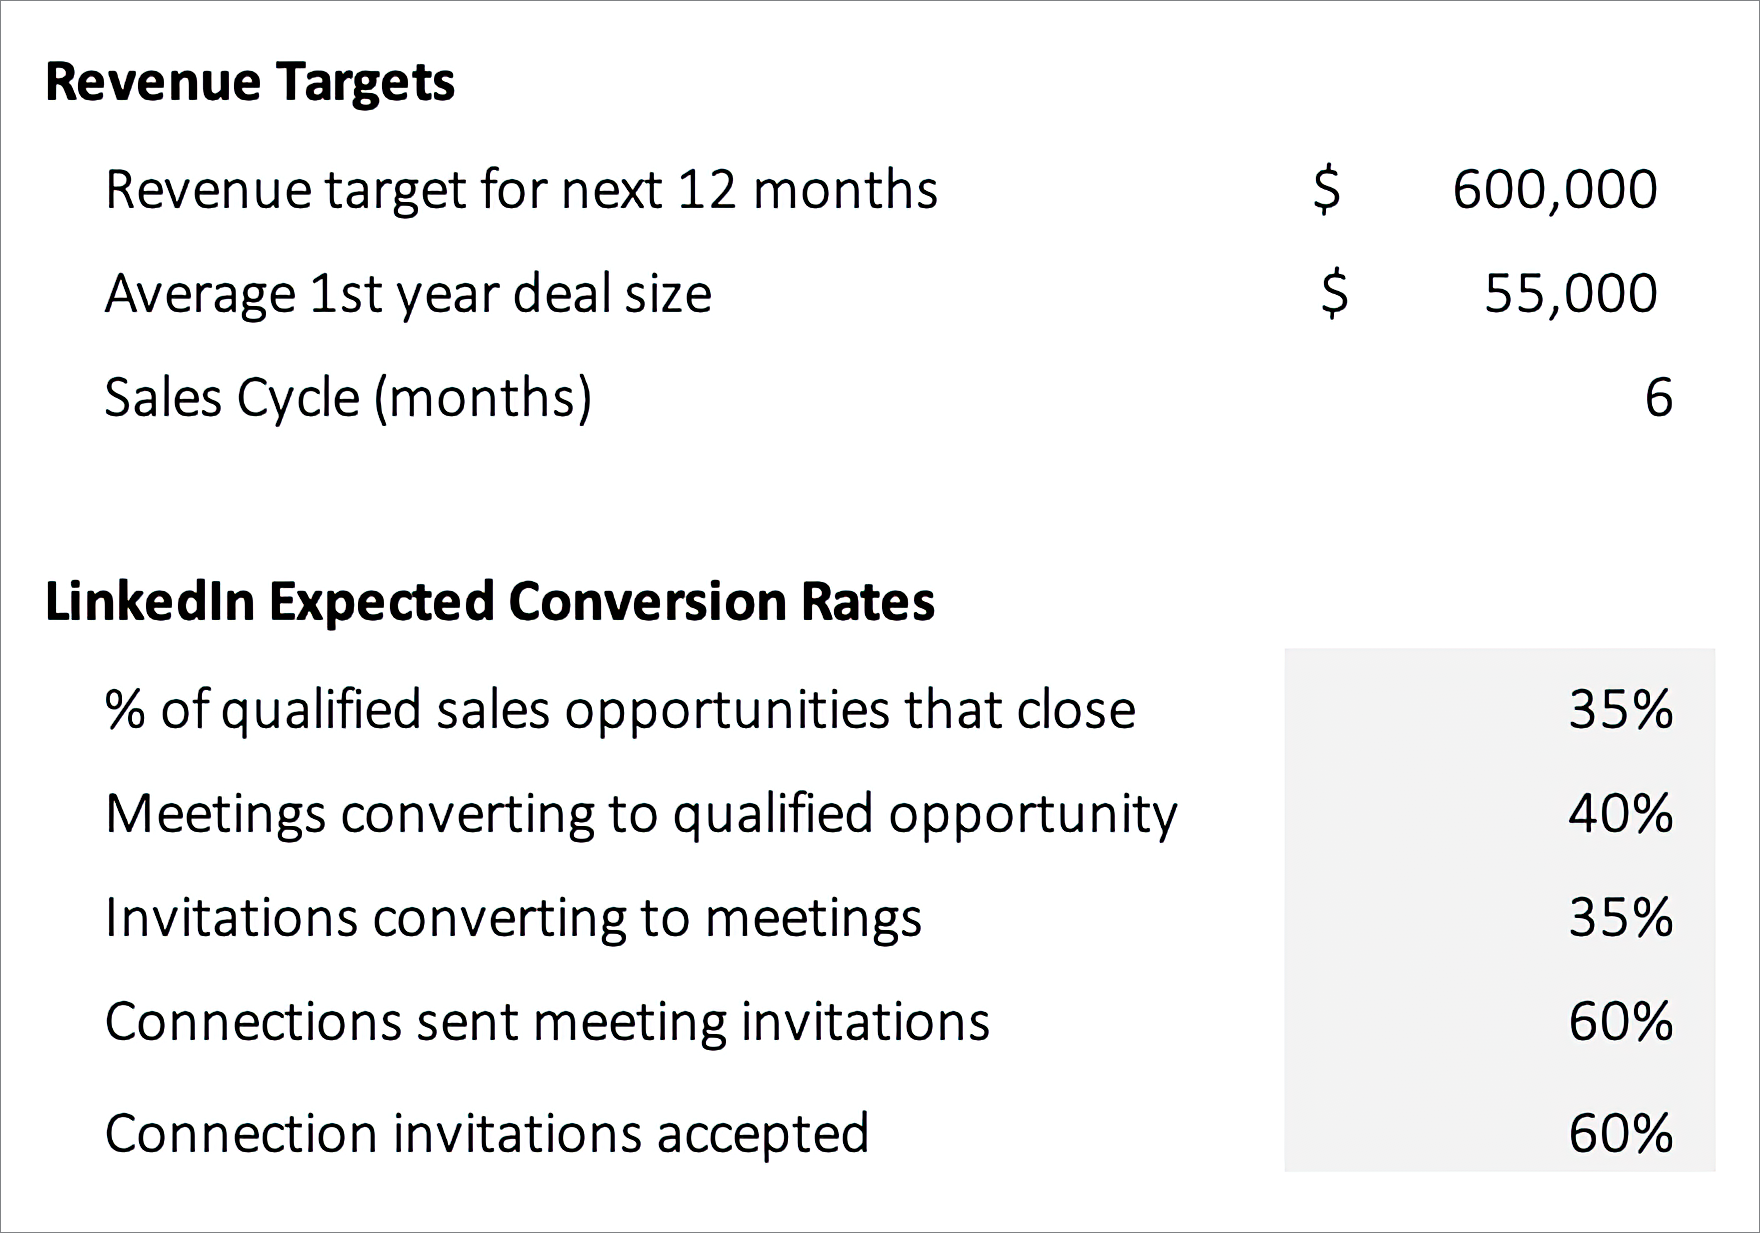
This allows you to determine how many leads you need in the pipeline and how quickly you achieve that.
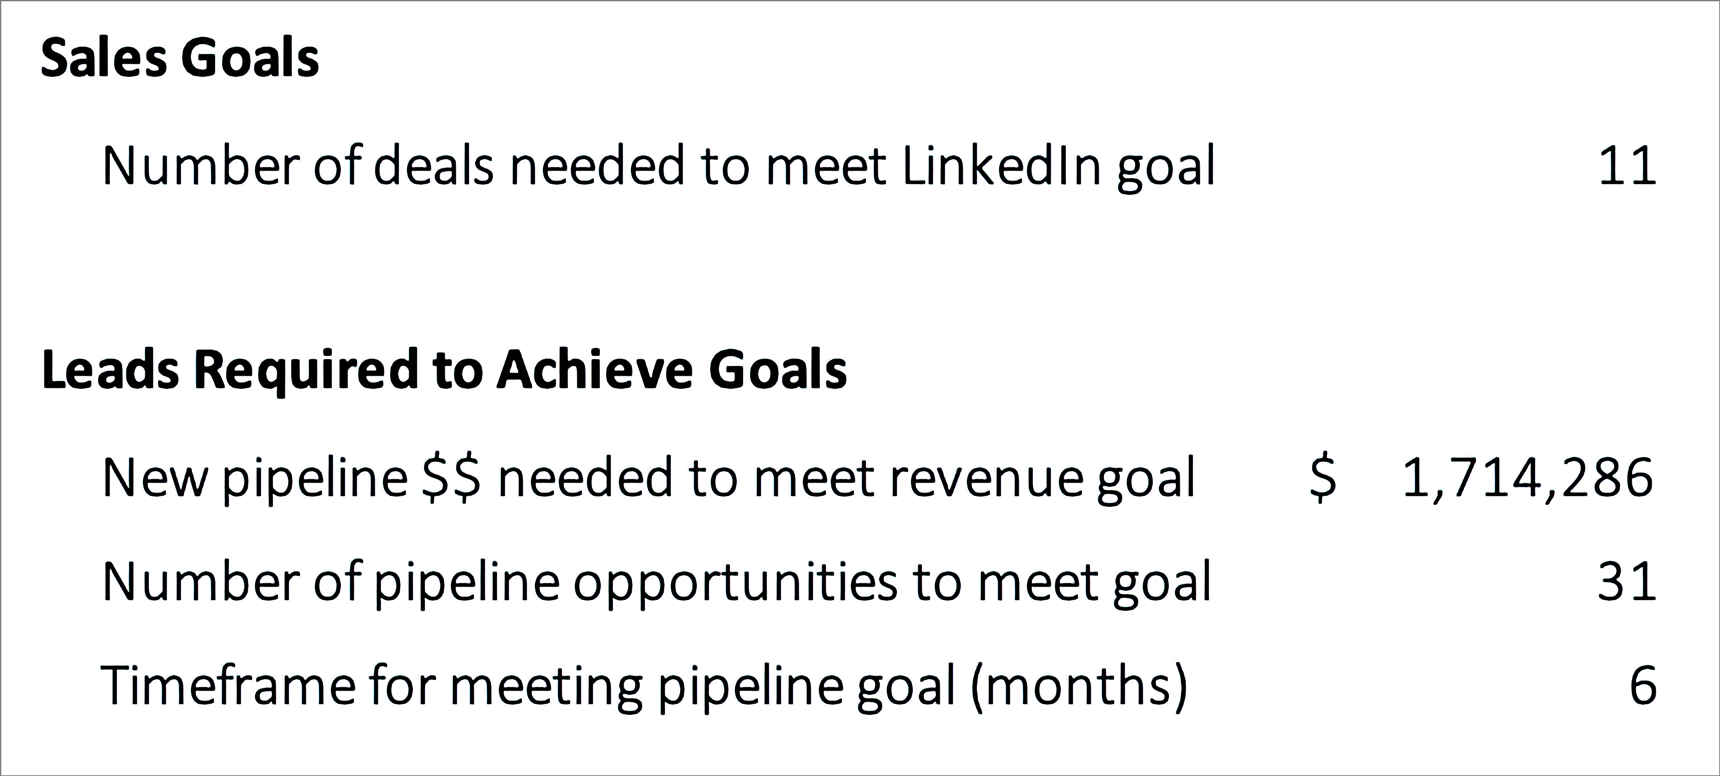
Using this data, we work backwards to determine the prospecting activities required at each stage to achieve your objective. The output is a customized 90-day plan with quarterly, monthly and weekly KPI goals.
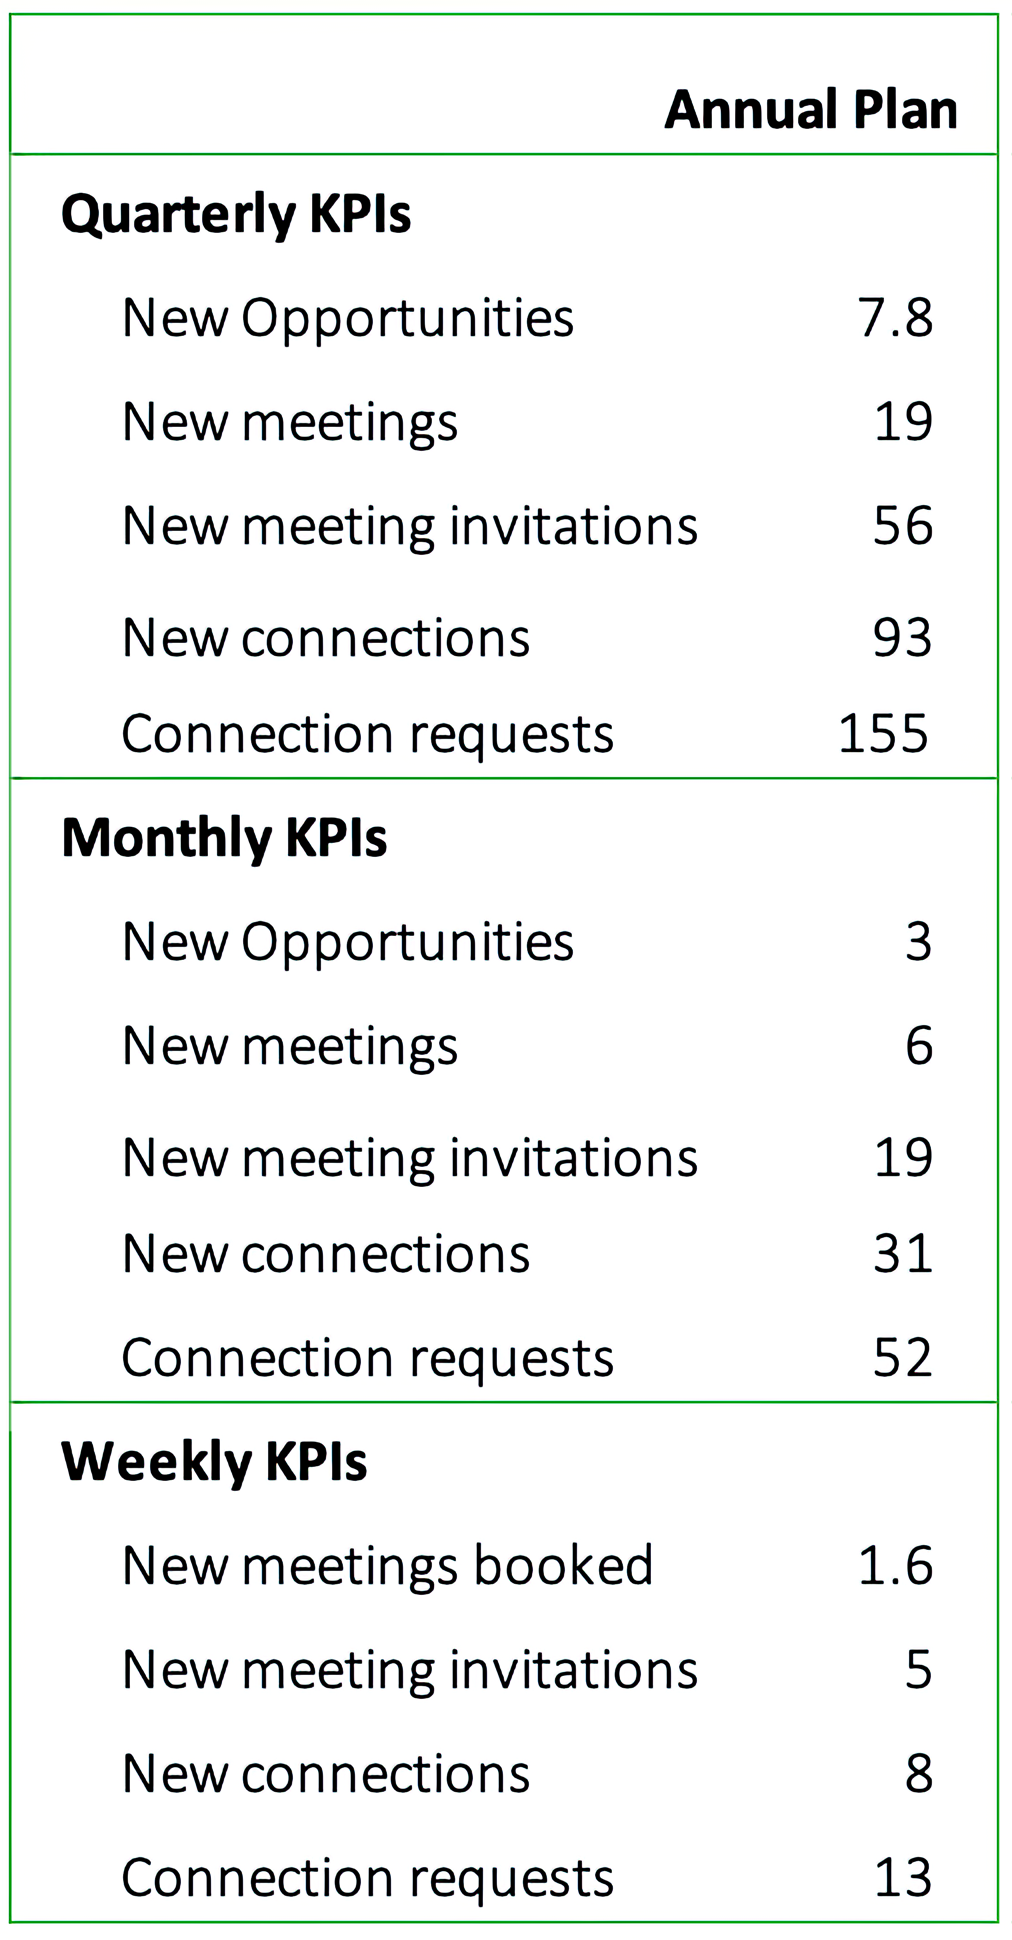
The plan provides the leading indicator KPIs you’ll track on an ongoing basis. These predict your success and allow course correction in real-time.
Rather than vague targets, you get precision metrics tailored to your business. Now you can accurately predict success upfront based on data. And you can focus on the activities that move the needle.
Check out this Video for an Example of the 90-Day Action Plan
In this video, I walk through how we prepare an action plan for a hypothetical seller we’ll call “Jenn.” Jenn has a million dollar quota. She has other deal sources like referrals and renewals that will help her meet about 40% of that goal.
So Jenn needs outbound prospecting to deliver $600K in sales. Her average deal size is $55K, so she needs 11 deals to meet the sales goal.
The sales cycle is an important part of the calculation. Jenn’s sales cycle averages 6 months (meaning the average deal takes 6 months to close). So that means she needs to build her pipeline well in advance to give deals enough time to close before the end of the year.
Knowing this, let’s work backwards from deal to lead in order to figure out Jenn’s prospecting KPIs.
About the Author: Candyce Edelen is founder of PropelGrowth, where she teaches B2B entrepreneurs and sales professionals to build authentic, human-to-human relationships on LinkedIn. Her strategies have helped clients shift from spammy automation to genuine outreach, resulting in higher-quality leads and increased sales. Candyce is passionate about helping professionals build trust and create a reliable, predictable sales pipeline. She's also a firm believer that you can't automate a relationship.
How Big Does the Sales Pipeline Need to Be?
Jenn has a 35% close ratio. For every 100 qualified deals in her pipeline, she’ll close 35.
That means she needs to have 31 deals in her pipeline with an aggregate value of $1.7M to meet her $600K goal (for this example, we’re not counting her other deal sources).
Since she’s got a 6-month sales cycle, she needs this pipeline to be in place within 6 months (assuming a 12 month quota period).
What Sales KPIs Should We Track for Filling the Pipeline?
Now let’s look at the conversion metrics to understand what’s going to be necessary to meet this pipeline goal.
Jenn finds that when she’s doing a really good job targeting her ICP (ideal customer profile), 40% of her first meetings tend to turn into sales opportunities. So she’ll need 78 meetings to add 31 opportunities to the pipeline.
In our Prospecting Accelerator, our members book meetings with about 65% of the connections they engage with via direct message (DM) and invite to meet. But let’s be conservative here and use a 35% benchmark for Jenn. That means she needs to invite 223 people to meet with her in order to get 78 meetings booked.
There are multiple reasons to connect on LinkedIn, and not all new connections will engage. Our Accelerator members get about 65% of their new connections to engage in dialogue via DM. Again, we’ll be conservative and assume that Jenn is able to engage in dialogue with and send meeting invitations to 60% of her new connections.
Based on averages in our Accelerator, we assume that when Jenn sends connection requests without pitching, she’ll get about a 60% connection acceptance rate.
That means she’ll need to send 618 connection requests, get 371 new connections, engage in dialogue with 223 and invite them to a 1-on-1 call.
Now We can Calculate Weekly and Monthly Prospecting KPIs
Now that we have these numbers, we can divide by 26 weeks (to account for the 6 month sales cycle). This gives us Jenn’s prospecting KPIs.
Every week, Jenn needs to research leads and send 26 targeted connection requests. She needs 15 new connections. She’ll need to engage at least 9 of them in dialogue in order to book 3 meetings.
If she does this consistently every week, by the end of the 90 days, she should have held 39 introductory meetings and added 16 deals to the pipeline. She’s halfway to her goal of 31 deals in the pipeline.
Human-to-Human Outreach Consistently Delivers Better Outcomes
Jenn will accomplish this goal by taking the time to do human-to-human outreach. She’ll research her leads to find nuggets of insight about her leads’ interests. Then she’ll use those nuggets to start conversations with her leads. Then she gently steers the conversation toward asking about her lead’s situation, so she can start uncovering the challenges they’re facing.
She’s able to get to know her prospects a bit first, so they know, like and trust her. If they trust her, they’ll be more open with her. This will ultimately lead to improved close ratios.
Our Accelerator Members Get Even Better Results
We teach this outreach methodology in Prospecting Mastery and our Prospecting Accelerator. We track member results closely. Most of our members get even better outcomes than the example with Jenn. But it does take consistent effort, practice, and applying the messaging strategy we teach. Those who try shortcuts rarely get good results.
Create your own Prospecting Action Plan
Now that you’ve read through this example and watched the video, it’s time to create your own plan. You should be able to follow my model and create your own.
Want help with this?
We have a limited number of slots to help you develop an action plan tailored to your specific situation. Click here to apply.
About the Author: Candyce Edelen is founder of PropelGrowth, where she teaches B2B entrepreneurs and sales professionals to build authentic, human-to-human relationships on LinkedIn. Her strategies have helped clients shift from spammy automation to genuine outreach, resulting in higher-quality leads and increased sales. Candyce is passionate about helping professionals build trust and create a reliable, predictable sales pipeline. She's also a firm believer that you can't automate a relationship.
Supercharge your prospecting and social selling on LinkedIn!
Get actionable tips to up your social selling game. You'll get ideas to help you optimize your LinkedIn profile, attract ideal leads, grow your network and book sales meetings with your ideal prospects.
Check your inbox and spam folder for a confirmation email. We hate SPAM and want to confirm your subscription before adding you to our list. We'll never sell or share your information, and you can unsubscribe anytime.


